Mapping Micro-Edges in Blackjack Variants: How Subtle Rule Tweaks Shift Expected Values Across Digital Tables
Written by Kai Beck · Aug 23, 2026

Mapping Micro-Edges in Blackjack Variants: How Subtle Rule Tweaks Shift Expected Values Across Digital Tables
Subtle adjustments to blackjack rules create measurable differences in expected value across digital platforms, and analysts track these micro-edges through detailed probability models that compare payout structures, deck counts, and dealer procedures in real time. Data from multiple gaming jurisdictions indicate that even minor changes such as the timing of dealer checks for blackjack or the number of decks in play can shift house edges by fractions of a percent, which compounds over thousands of hands dealt each day. Observers note that software providers implement these tweaks to balance player retention with operator margins, and the resulting variations appear consistently in game logs published by regulatory bodies.
Core Mechanics Behind Expected Value Shifts
Basic strategy charts adjust whenever a rule changes because the probabilities for player decisions depend on the exact composition of the remaining cards and the specific payout ratios offered. Researchers at institutions studying gambling mathematics have demonstrated that reducing the number of decks from eight to six improves player expected value by approximately 0.03 percent when all other rules remain constant, while switching from 3:2 to 6:5 blackjack payouts reduces that value by roughly 1.4 percent according to calculations performed by independent testing labs. These figures emerge from combinatorial analysis that enumerates every possible outcome across millions of simulated hands, and digital platforms expose the differences immediately because automated dealing removes human error from the equation.
Deck Penetration and Reshuffle Triggers
Digital tables often allow operators to set custom penetration points where the virtual shoe reshuffles, and deeper penetration generally favors players who track remaining cards even though most casual participants do not. Figures released by the Nevada Gaming Control Board show that tables reshuffling after 75 percent penetration instead of 50 percent can move the house edge downward by 0.2 to 0.5 percent depending on the exact ruleset in force, yet the same change increases volatility for the house because larger bets occur during favorable segments. Software algorithms enforce these triggers uniformly, which means players encounter identical conditions on every session rather than the variable cut-card placements common in land-based environments.
Regional Rule Variations Across Platforms
Platforms licensed in different jurisdictions apply distinct combinations of rules that reflect local regulations and market preferences, and these combinations produce distinct expected value profiles that players can compare through published game specifications. In markets overseen by the Alcohol and Gaming Commission of Ontario, for instance, many digital variants permit doubling on any two cards while restricting surrender to specific totals, whereas operators under the New Jersey Division of Gaming Enforcement frequently allow both early and late surrender but limit doubling to hard totals of nine through eleven. Each configuration alters the optimal decision matrix and therefore the long-term return percentage, and comprehensive mapping of these configurations requires systematic testing across the available rule sets rather than reliance on generic strategy cards.
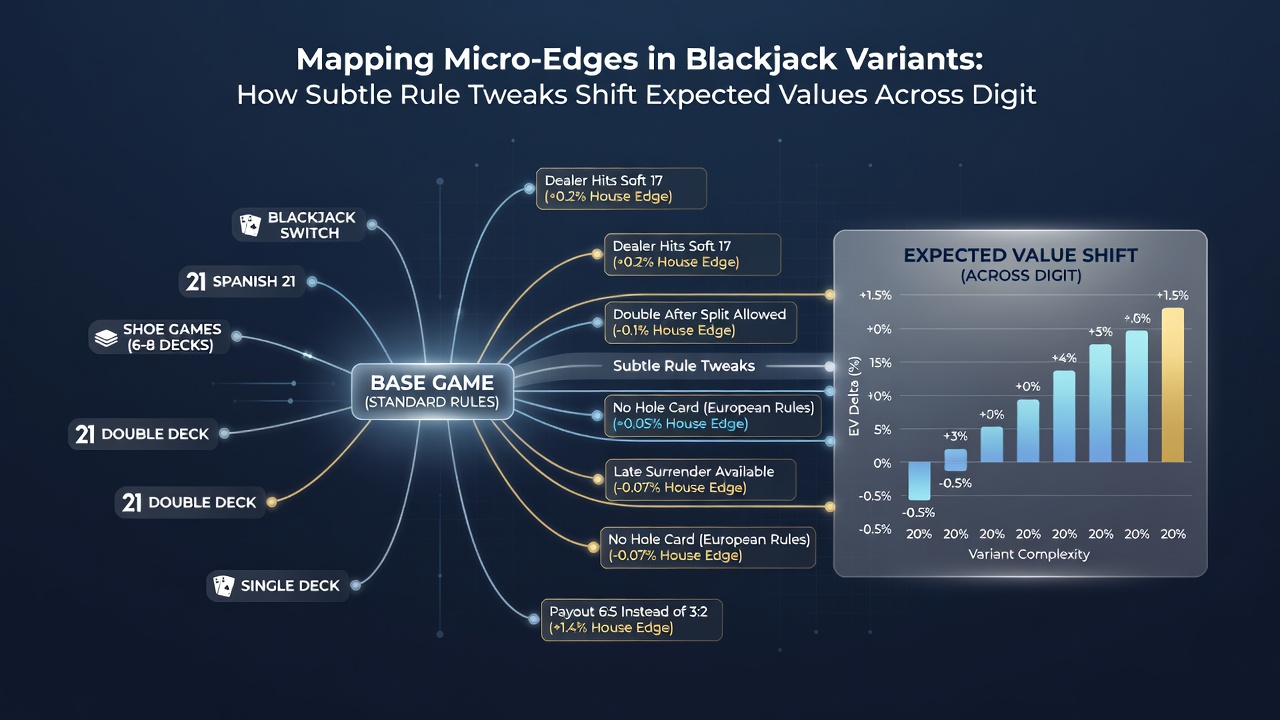
Additional differences arise from the treatment of split hands and the availability of side bets, although the core game edges remain the primary focus when operators publish theoretical return percentages. Studies conducted by academic teams at institutions such as the University of Nevada, Las Vegas have quantified how allowing resplitting of aces changes expected value by roughly 0.08 percent while simultaneously increasing the frequency of maximum bets on subsequent hands. These incremental gains accumulate across high-volume play, and digital systems record the precise outcomes needed to verify that published return percentages match actual results over extended periods.
Analytical Tools Used by Researchers
Modern mapping of micro-edges relies on Monte Carlo simulations combined with exact combinatorial calculations that enumerate every reachable game state under a given ruleset. Analysts feed the specific parameters of each variant into custom software that outputs both the overall house edge and the sensitivity of that edge to individual rule components, which allows rapid comparison across hundreds of table configurations. Reports from the Australian Communications and Media Authority indicate that operators in that region have begun publishing these sensitivity analyses alongside standard game information, giving players transparent data on how rule choices affect long-term returns. The same transparency appears in certain European markets where national gaming authorities require periodic audits that include edge calculations under multiple deck and payout scenarios.
Impact on Multi-Hand and Multi-Table Play
When players participate at multiple digital tables simultaneously, the aggregate expected value reflects the weighted average of each table's individual edge, and small differences become more noticeable because total hands per hour increase. Data collected by independent testing organizations demonstrate that selecting tables with the most favorable micro-edges across a session of several hundred hands can produce measurable differences in session results even when individual edges remain below one percent. Platform interfaces now display rule summaries directly in the lobby, enabling quick identification of tables whose parameters align with a player's preferred strategy adjustments.
Conclusion
Mapping micro-edges requires ongoing attention to the precise rule parameters active on each digital table because those parameters determine the mathematical foundation of every hand. Regulatory disclosures, academic analyses, and industry reports together provide the raw data needed to track how deck counts, payout ratios, surrender options, and reshuffle points shift expected values across variants. Players and analysts who consult these sources can identify the configurations that produce the narrowest house edges without relying on subjective impressions of game flow. As platforms continue to expand their variant libraries through 2026, systematic comparison of published specifications remains the most reliable method for understanding the cumulative effect of subtle rule tweaks.